
Research
Tommy Geoco

The fog between layoffs and prototyping
In this post
001. Peering Into The Fog
002. Where The Two Datasets Meet
003. What To Measure Next
Happy Saturday.
I spent two weeks making a twenty-minute video about the reality of design work right now.
I pulled at the emotional texture of the transition, the part that doesn't fit in a chart.
The whole time we were editing, I kept pulling up the same two browser tabs: a layoff tracker and an AI usage study. They tell completely different stories.
Let’s take a look.
– Tommy (@designertom)
TOGETHER WITH FRAMER

Framer → How I build websites without code
Framer just announced the 2025 Awards winners this week: 11 creators, $100K in prizes across 10 categories. The winning sites are worth browsing.
A few things worth knowing about where Framer is right now:
$2B valuation after a $100M Series D last August — 500K+ monthly active users, 20%+ month-over-month growth
Server API in open beta → your site is now programmable from the outside — AI agents, webhooks, and scheduled jobs can publish and manage without opening the editor
Framer Convert → A/B testing, funnels, and dynamic triggers shipped last week, all in one add-on
Freeform canvas. One-click to production. Wireframer generates multiple pages side-by-side. All free, unlimited projects.
It's what we use for the UX Tools site. We recommend it.
Peering Into The Fog
The Burry Stock Tracker puts 2026 tech layoffs above 45,000 — 635 people per day, Amazon 16K among them.
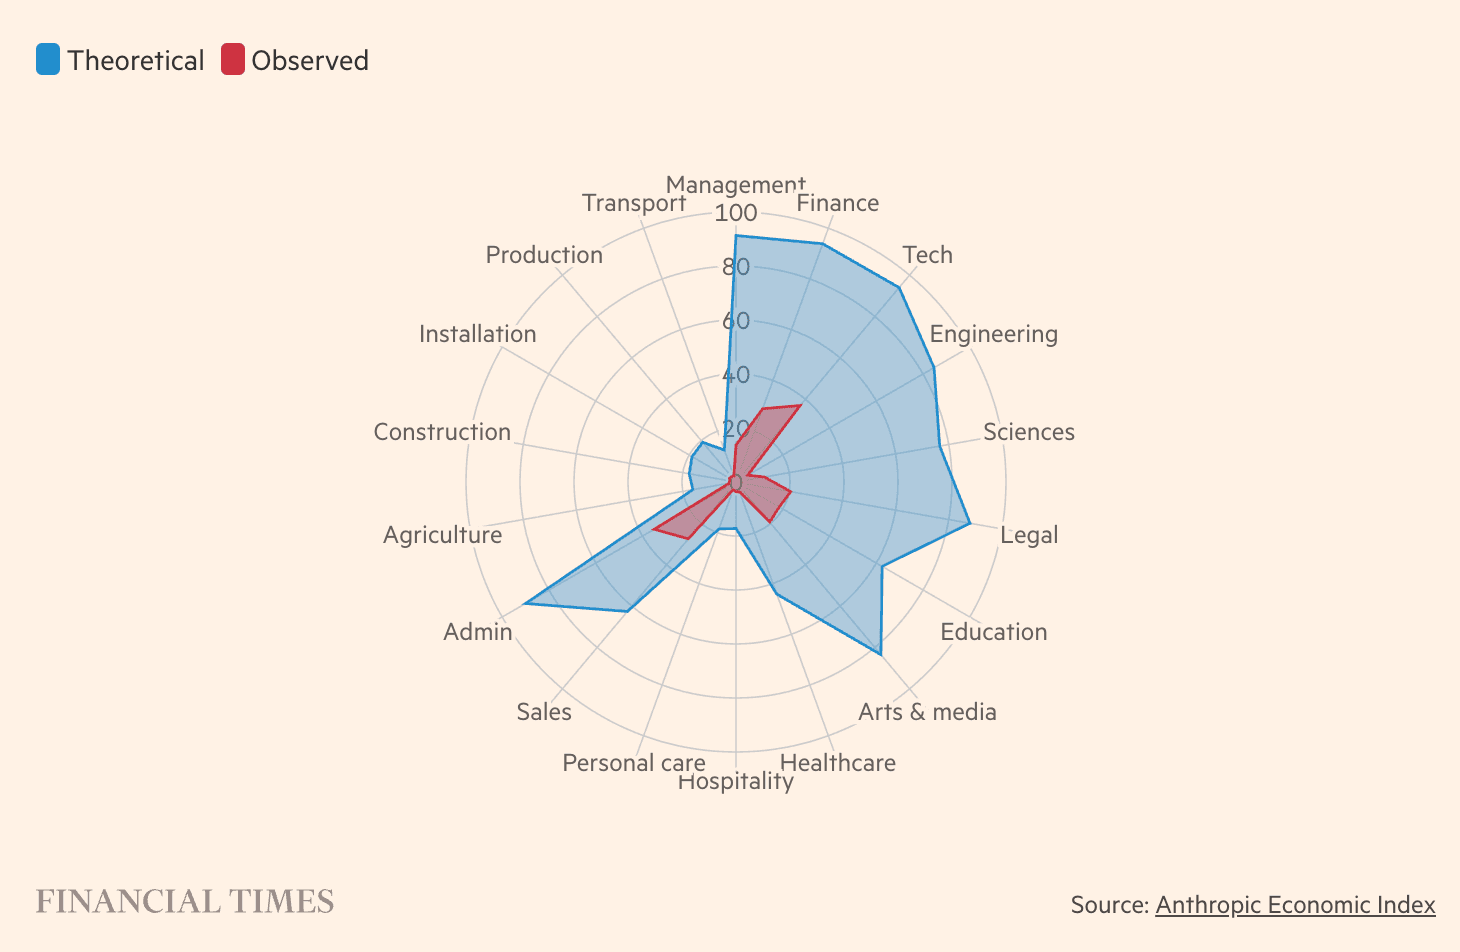
Then the Financial Times takes apart Anthropic's own exposure data ) and finds the gap between theoretical exposure and actual use is enormous. Computer & Math occupations — the category that includes us — show 33% observed usage against much higher theoretical exposure. Entry-level hiring is slowing. The mass displacement narrative hasn't materialized.
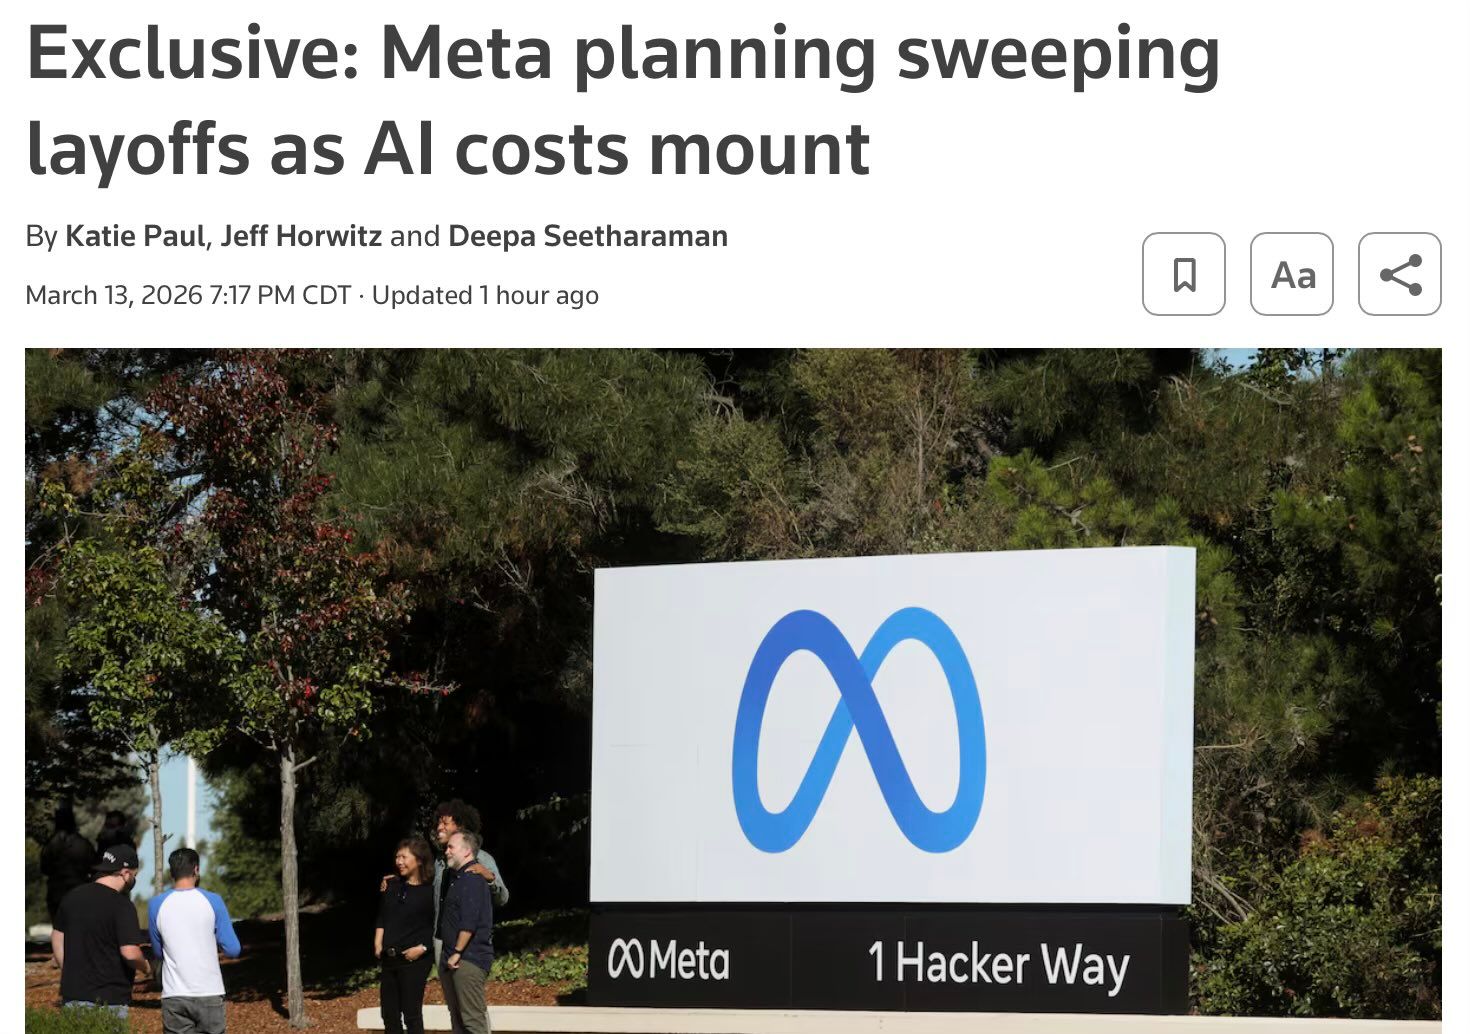
Meta managed to hold both signals at once. The company is planning layoffs affecting 20% or more of its 79,000 employees — Zuckerberg framing the cuts as AI efficiency gains — while its flagship model, internally called "Avocado," was delayed from March to at least May after falling short on benchmarks against Google, OpenAI, and Anthropic. A company committed to $600 billion in AI infrastructure by 2028 is cutting a fifth of its people while the model it's building toward isn't ready.
The layoff data tells you who lost their seat — not what changed for everyone still in theirs. The usage data tells you what models can do in theory, not what practitioners actually reach for on a Tuesday.
The social commentary mostly picks a lane because ambiguity doesn't package well. Both signals are real.
But I think the resolution is going to take longer than anyone's timeline suggests.
Where The Two Datasets Meet
I keep coming back to prototyping.
Not because it's safe or comfortable, but because it's where the employment data and the workflow data actually intersect.
This week alone:
Chamath's team rebuilt and replaced Jira in roughly six weeks with a PM, a designer, and an architect describing intent while AI handled implementation.
Replit announced a massive release in Agent 4, calling it “the first AI built for creative collaboration between humans and agents.”
Todd Grilliot built Pixel Engine, a custom animation model for sprite sheets, because general-purpose models couldn't handle the specificity his work demanded.
And AMD framed the PC itself as agent-operated rather than human-operated, which means the prototyping surface is about to extend well beyond a design tool.
Every one of these involves someone describing what they want and building the bridge to the artifact.
That's prototyping — the word just covers more ground now.
And the roles holding up in the job data share that exact shape: the person understands the problem well enough to describe "done" and judge whether the output got there.
What To Measure Next
That gap between what tools can theoretically do and what people are actually doing with them — that's the thing I want to close.
We killed the annual UX Tools survey because end-of-year snapshots stopped being useful — too broad for a market moving this fast, and too stale by the time they shipped.
We replaced it with quarterly thematic snapshots. Each one asks about a single dimension of how the work is changing. Spring 2026 is the first one. One topic: the percentage of your building time spent describing intent and letting AI fill in the blanks.
Four minutes or less. If enough designers answer honestly, we'll have the first real count of how prototyping actually works right now — not a benchmark, not a theoretical model, just a number from the people doing the work.
These are tools I actually use, so I asked them to sponsor the newsletter. They said yes. The best way to support us is to check them out 👇
Framer → How I build websites without code
Mobbin → How I find design patterns fast
MagicPath → How I design in canvas
Contra → How I hire and manage freelancers
Dscout → How I run user research
That's it for today.
Still in the fog. But prototyping is the flashlight. If you have four minutes, the survey is the best way to help us all see further.
See you next week,
Tommy